Internal Debugger
Purpose
The Internal Debugger provides:
Usage
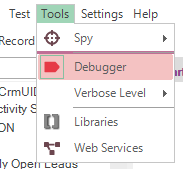
To enable the debugger for a test, click the  button on the toolbar or select the
 Tools > Debugger menu option:
Set a breakpoint on the first line of the Test function and click the Play button on the toolbar.
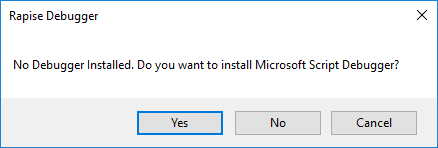
If you start debugging for the first time, Rapise may prompt you to install Microsoft Script Debugger:
Follow the prompts. When Microsoft Script Debugger is installed, click
Playagain.
Rapise will stop execution at the first line of the test and display the debugger controls and views.
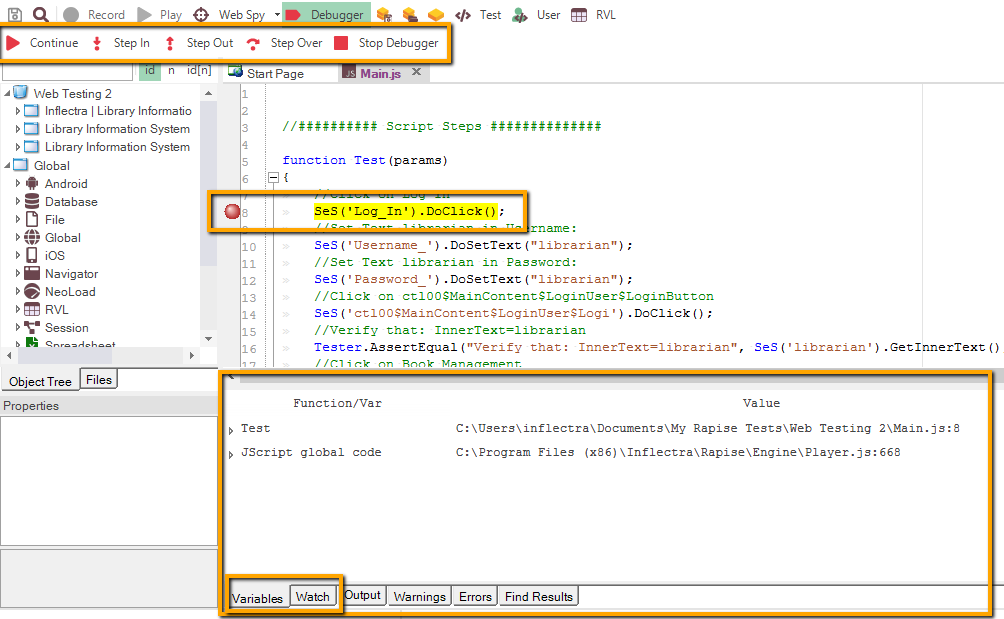
In the screenshot above, you can see the Debugger buttons available on the toolbar at the top of the screen, as well as the Variables and Watch sections in the lower pane. The next statement is highlighted in yellow.