Data-Driven Testing
Many test automation scenarios require performing the same steps with different data. For example, you might need to log into an application with various user credentials, or enter several lines of a sales order into a table. This approach is known as data-driven testing. In this article, you will learn how to accomplish this in Rapise Visual Language (RVL) and JavaScript modes. You will also learn how to define data within a test and in an external spreadsheet.
DDT in RVL
Let's begin with RVL mode. With RVL, you can delegate low-level, complex automation tasks to a development team and focus on testing scenarios and the data used to fill forms and tables.
Embedded Data
First, define the data schema. In the Flow column of the RVL spreadsheet, choose Map.
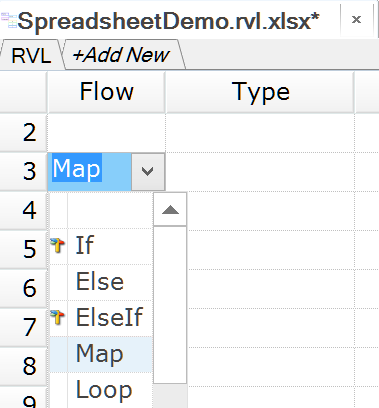
Then, press Tab on the keyboard, and Rapise will generate a template for the data table.
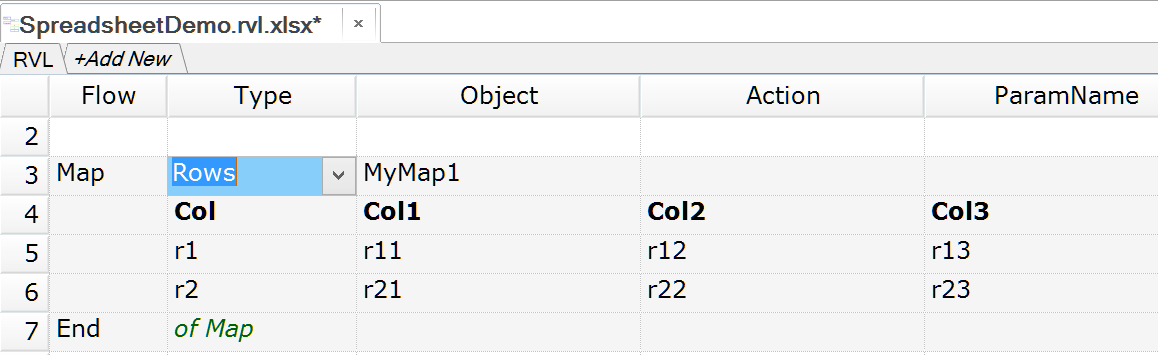
Give this new map a name and define its columns and an initial set of rows with values.
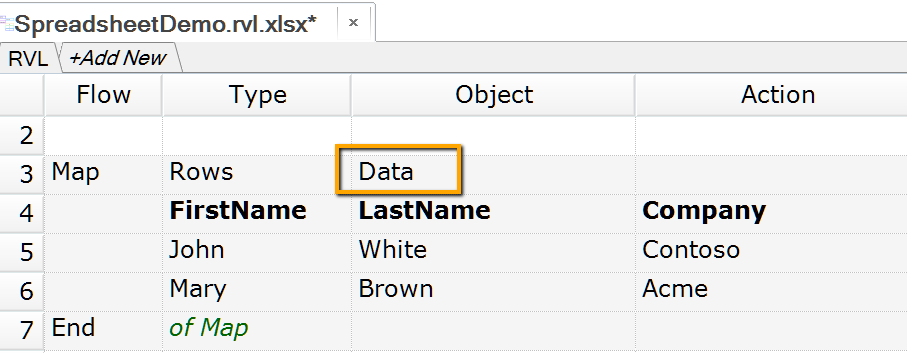
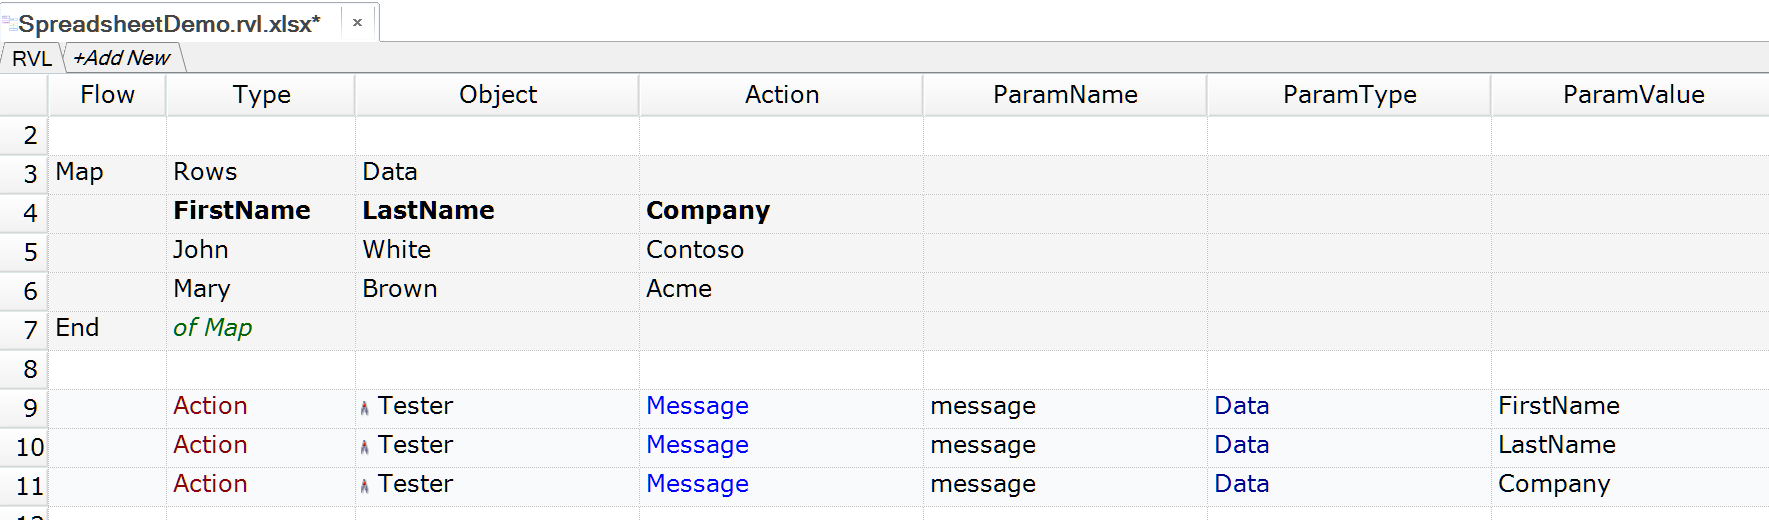
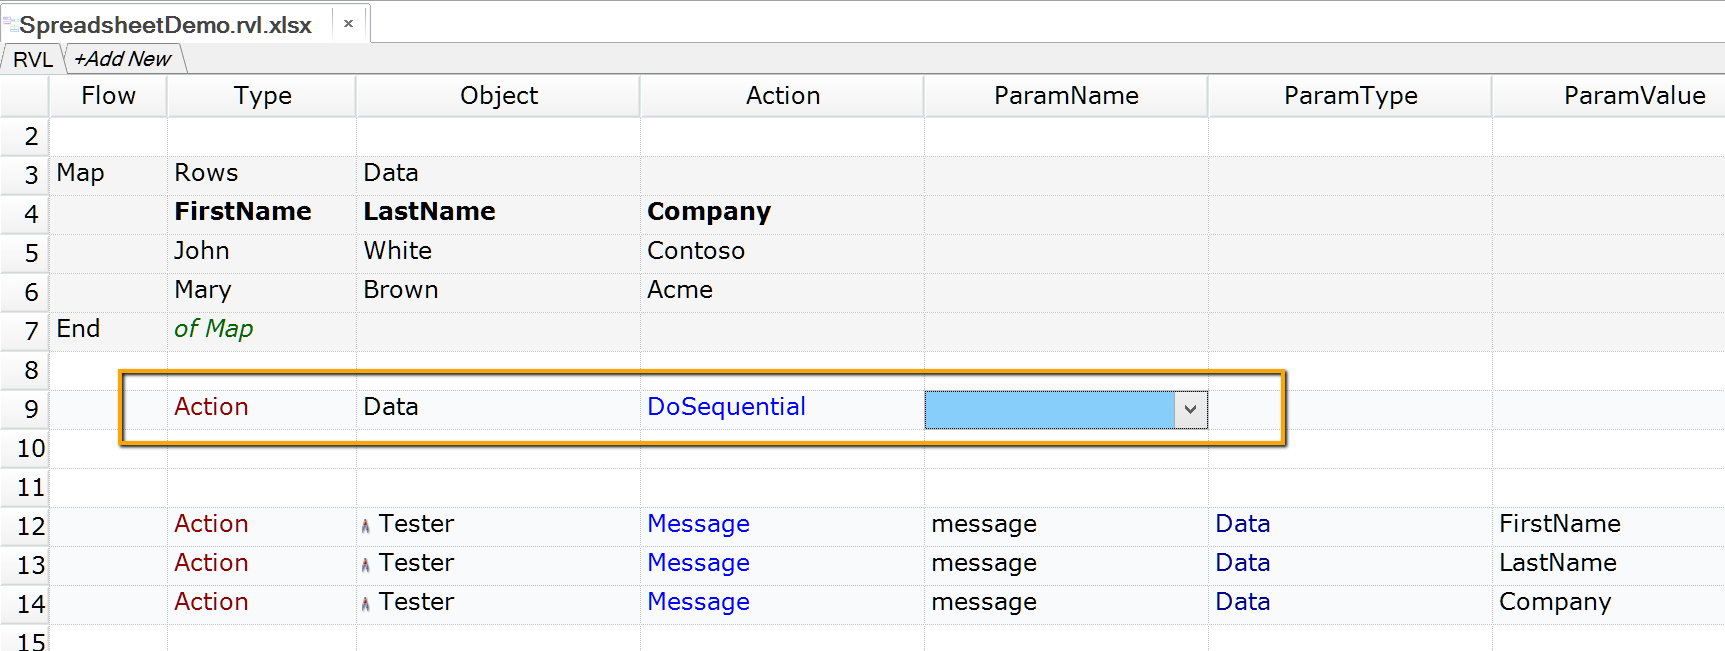
In our example, the map is named Data and has three columns: FirstName, LastName, and Company. It also includes two rows with data values.
Now, in our test, we can simply use the map and refer to its columns by name.

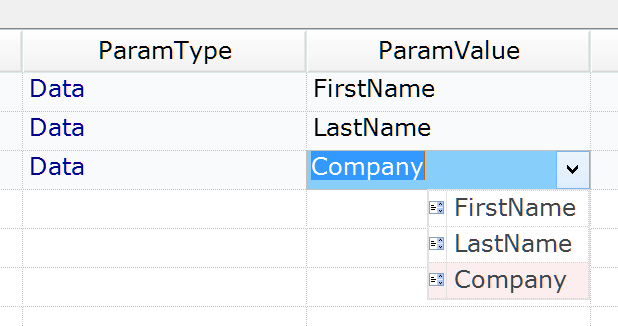
Data becomes one of the parameter types.
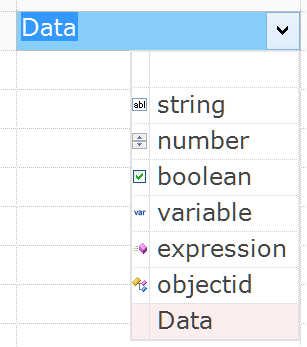
And when Data is selected as a parameter type, the column names are available in the drop-down list.
Our RVL now looks like this.
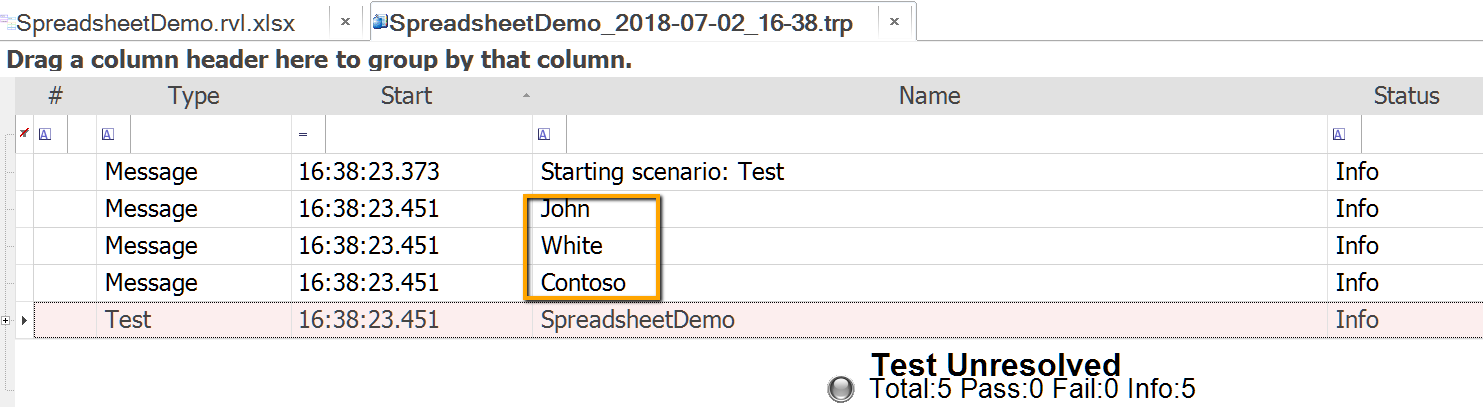
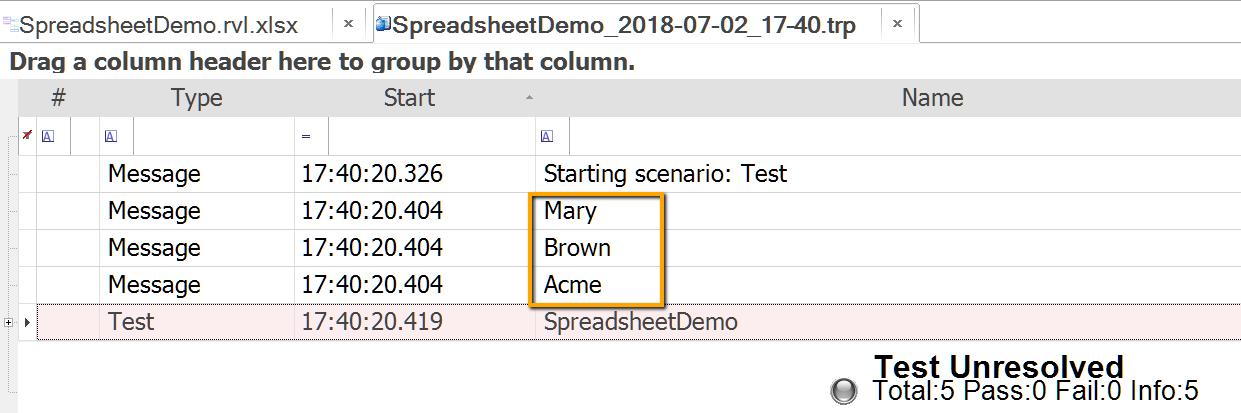
Executing the test produces the report. The test simply prints the first line of the data table.
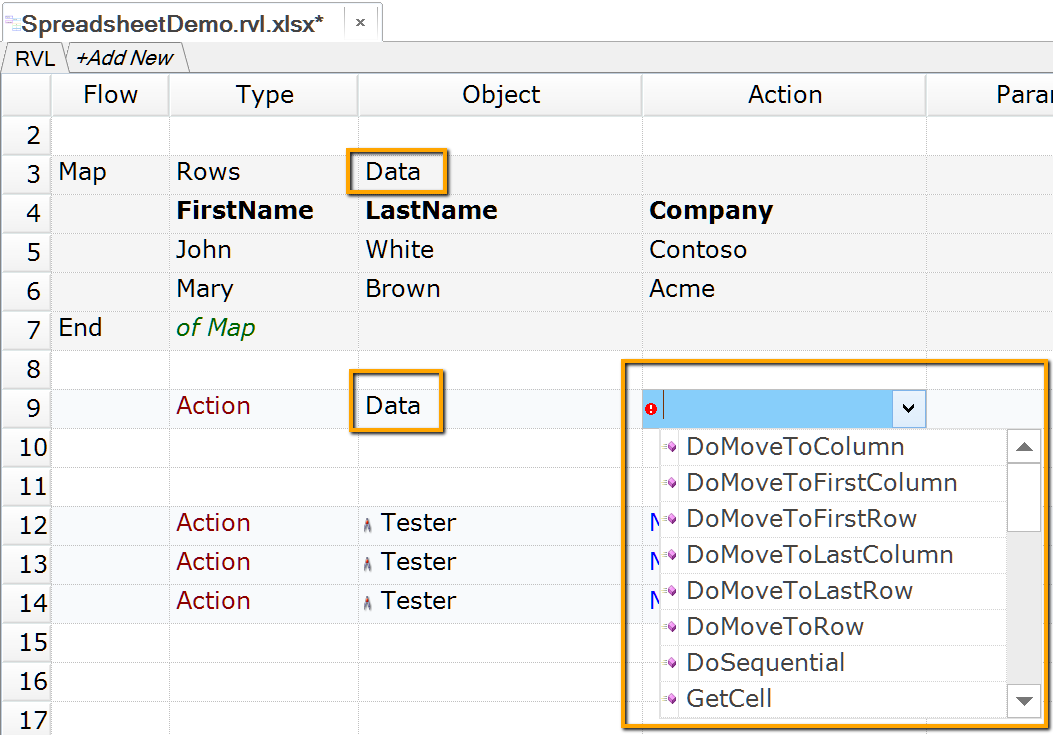
The data table we just created is an object in the Rapise object repository and has actions. With these actions, one can manipulate the active row and column index and read arbitrary data from the table.
For a detailed description of actions that can be performed on data tables, refer to the Map Object reference.
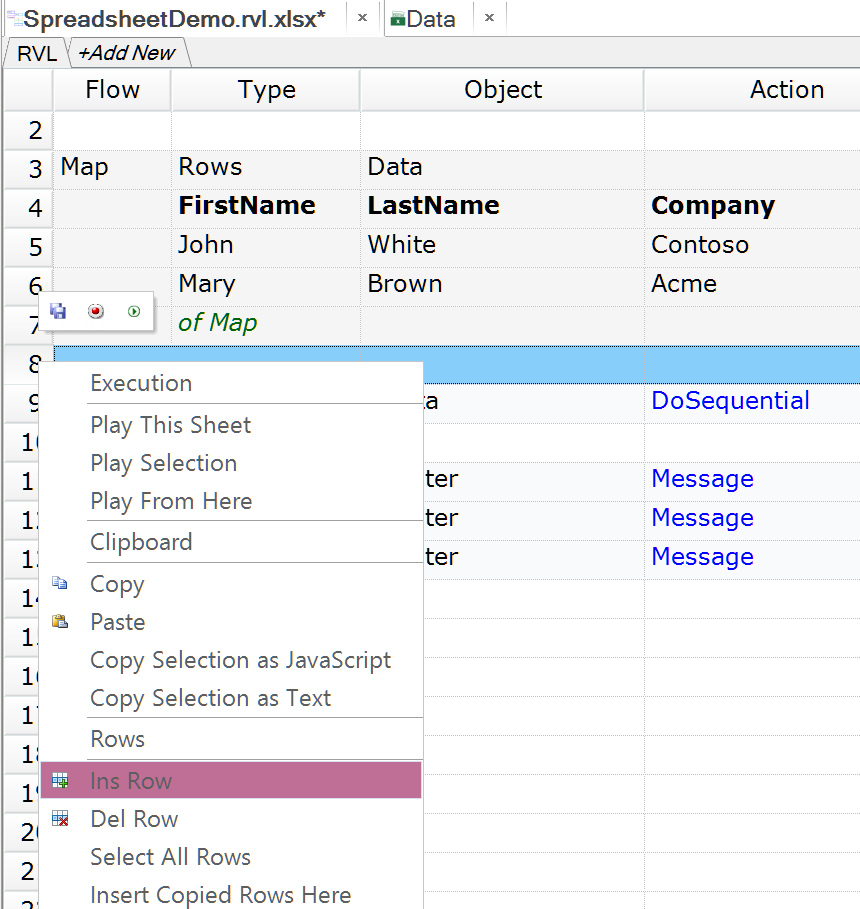
Let's advance to the next row in our table before printing values.
After execution, the report displays data from the second row.
Excel Data
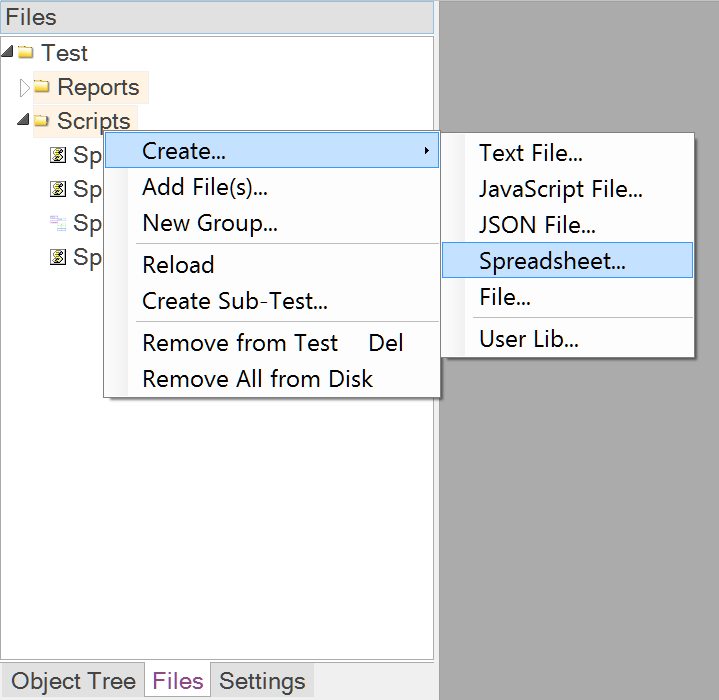
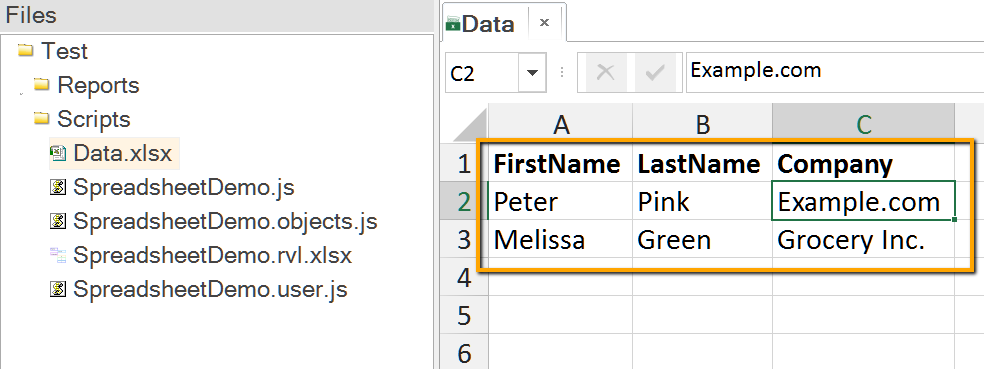
Now, we are ready to place data into an external spreadsheet. Let's create one. In the Files view, right-click the Scripts folder and choose Create > Spreadsheet...
We will proceed with the default options.
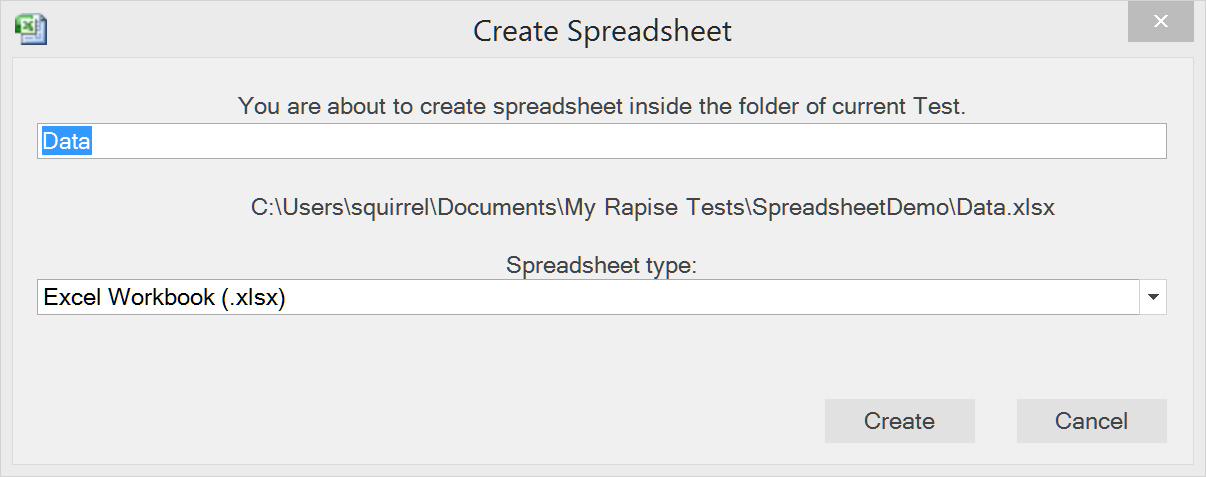
Rapise has a built-in spreadsheet editor, so you do not need Excel to be installed on the machine.
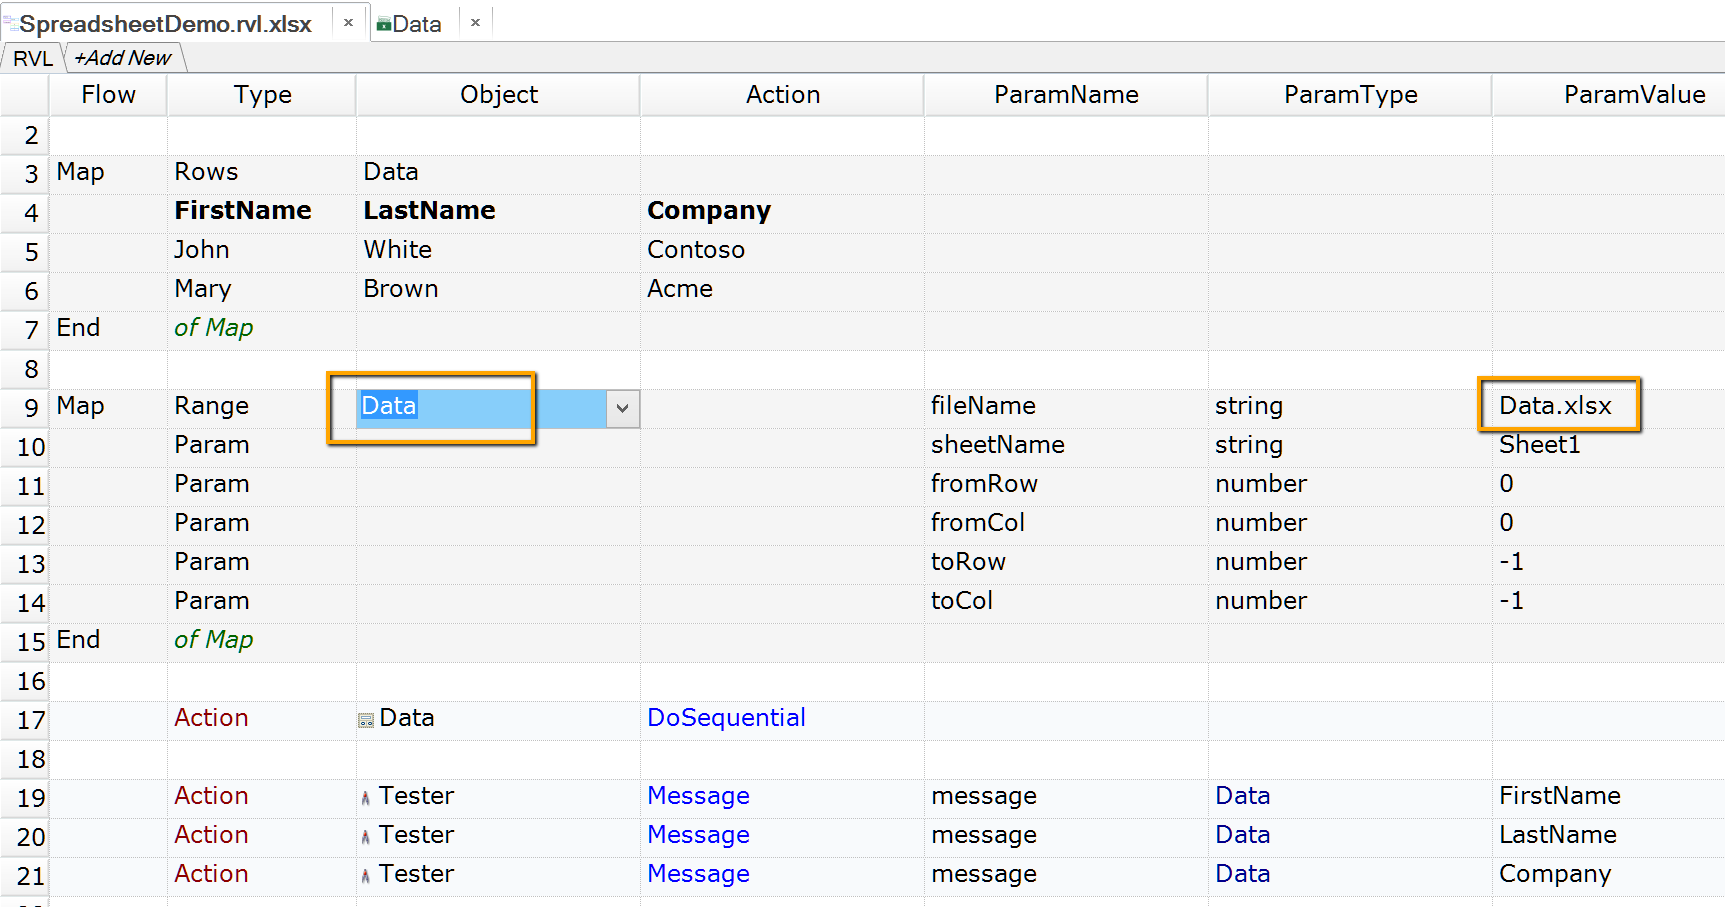
Let's bind to this spreadsheet in RVL. Insert a line below the Data map we created in the previous section. In the Flow column, choose Map and then set the map type to Range.
Give the map the same name, Data, and ensure that it references Data.xlsx, which we just created.
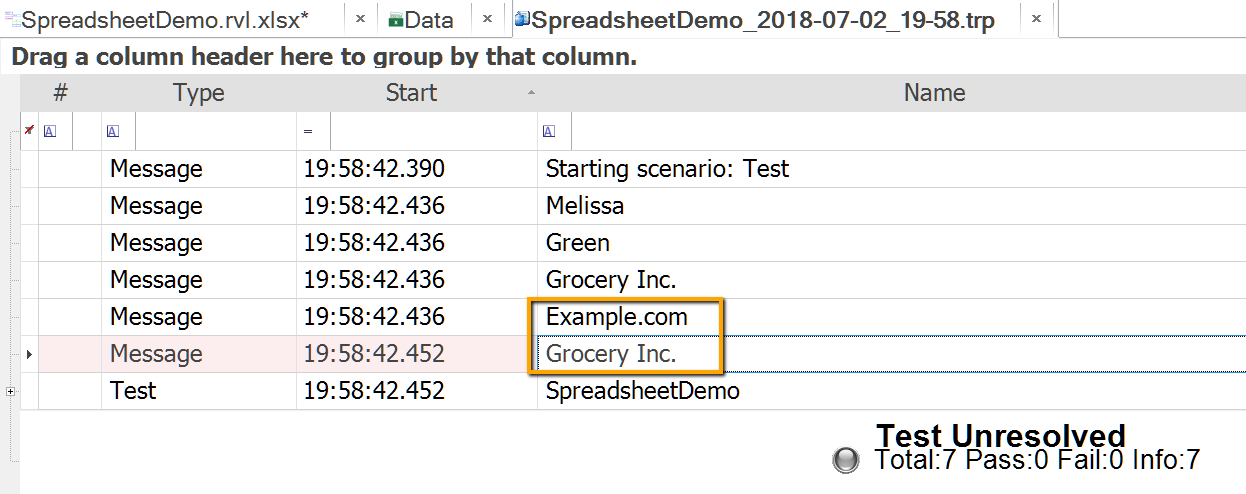
When the test is run, data is now sourced from Data.xlsx. Notice that in Data.xlsx, we named the columns in the same way as in the previous section.
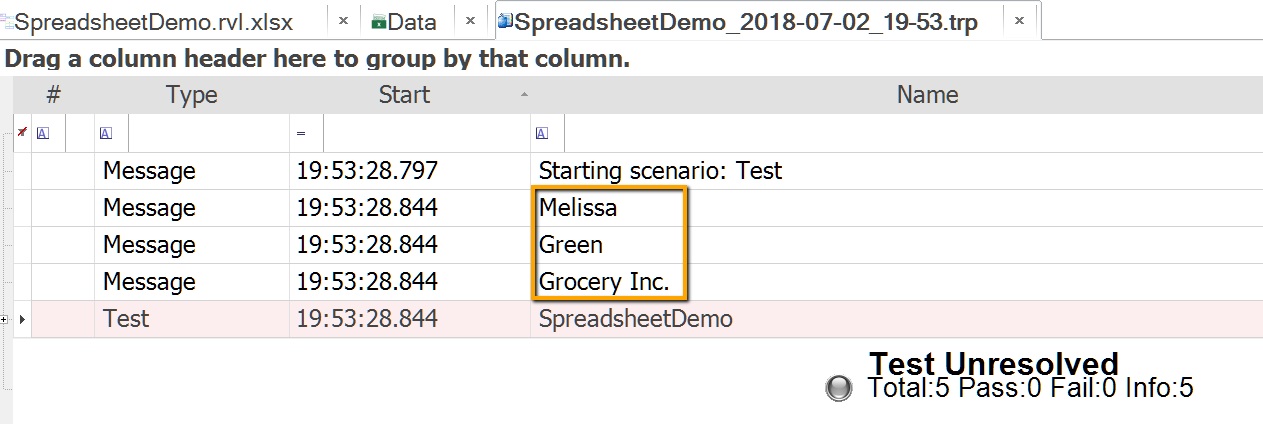
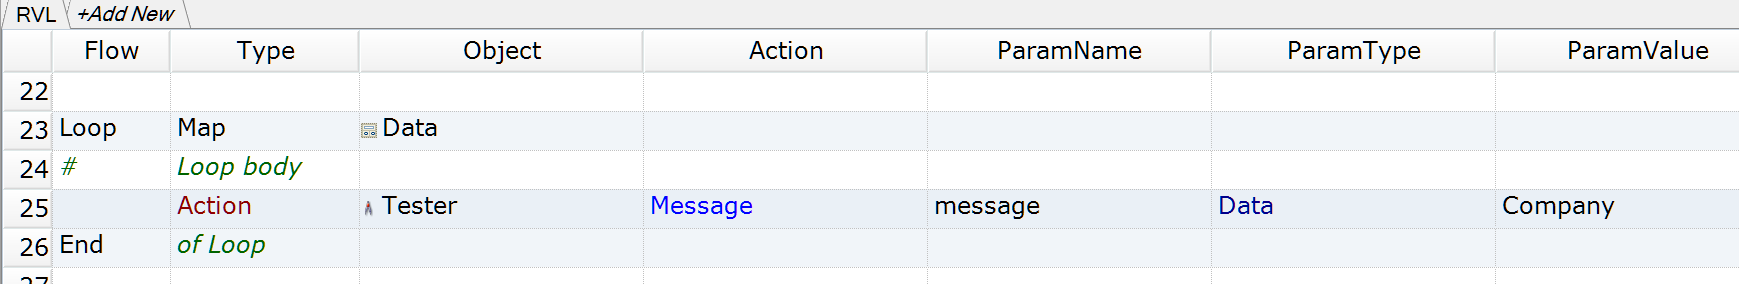
If we perform a loop with the Data map, Rapise will iterate through all lines during execution.
DDT in JavaScript
Data can also be read from a spreadsheet in JavaScript mode. A global Spreadsheet object is available in every test. Here is an example of Spreadsheet API usage.
Spreadsheet.DoAttach('Calc.xls', 'Calc Data');
while(Spreadsheet.DoSequential())
{
    EnterNumber(Spreadsheet.GetCell("Item1"));
    Operation(Spreadsheet.GetCell("Operation"));
    EnterNumber(Spreadsheet.GetCell("Item2"));

    SeS('ResultButton').DoAction();

    Tester.Assert( '' + Spreadsheet.GetCell("Item1") +
                   Spreadsheet.GetCell("Operation") +
                   Spreadsheet.GetCell("Item2") + '=' +
                   Spreadsheet.GetCell("Result"),
                   CheckResult(Spreadsheet.GetCell("Result")));
}
A description of all Spreadsheet actions and properties is available here.
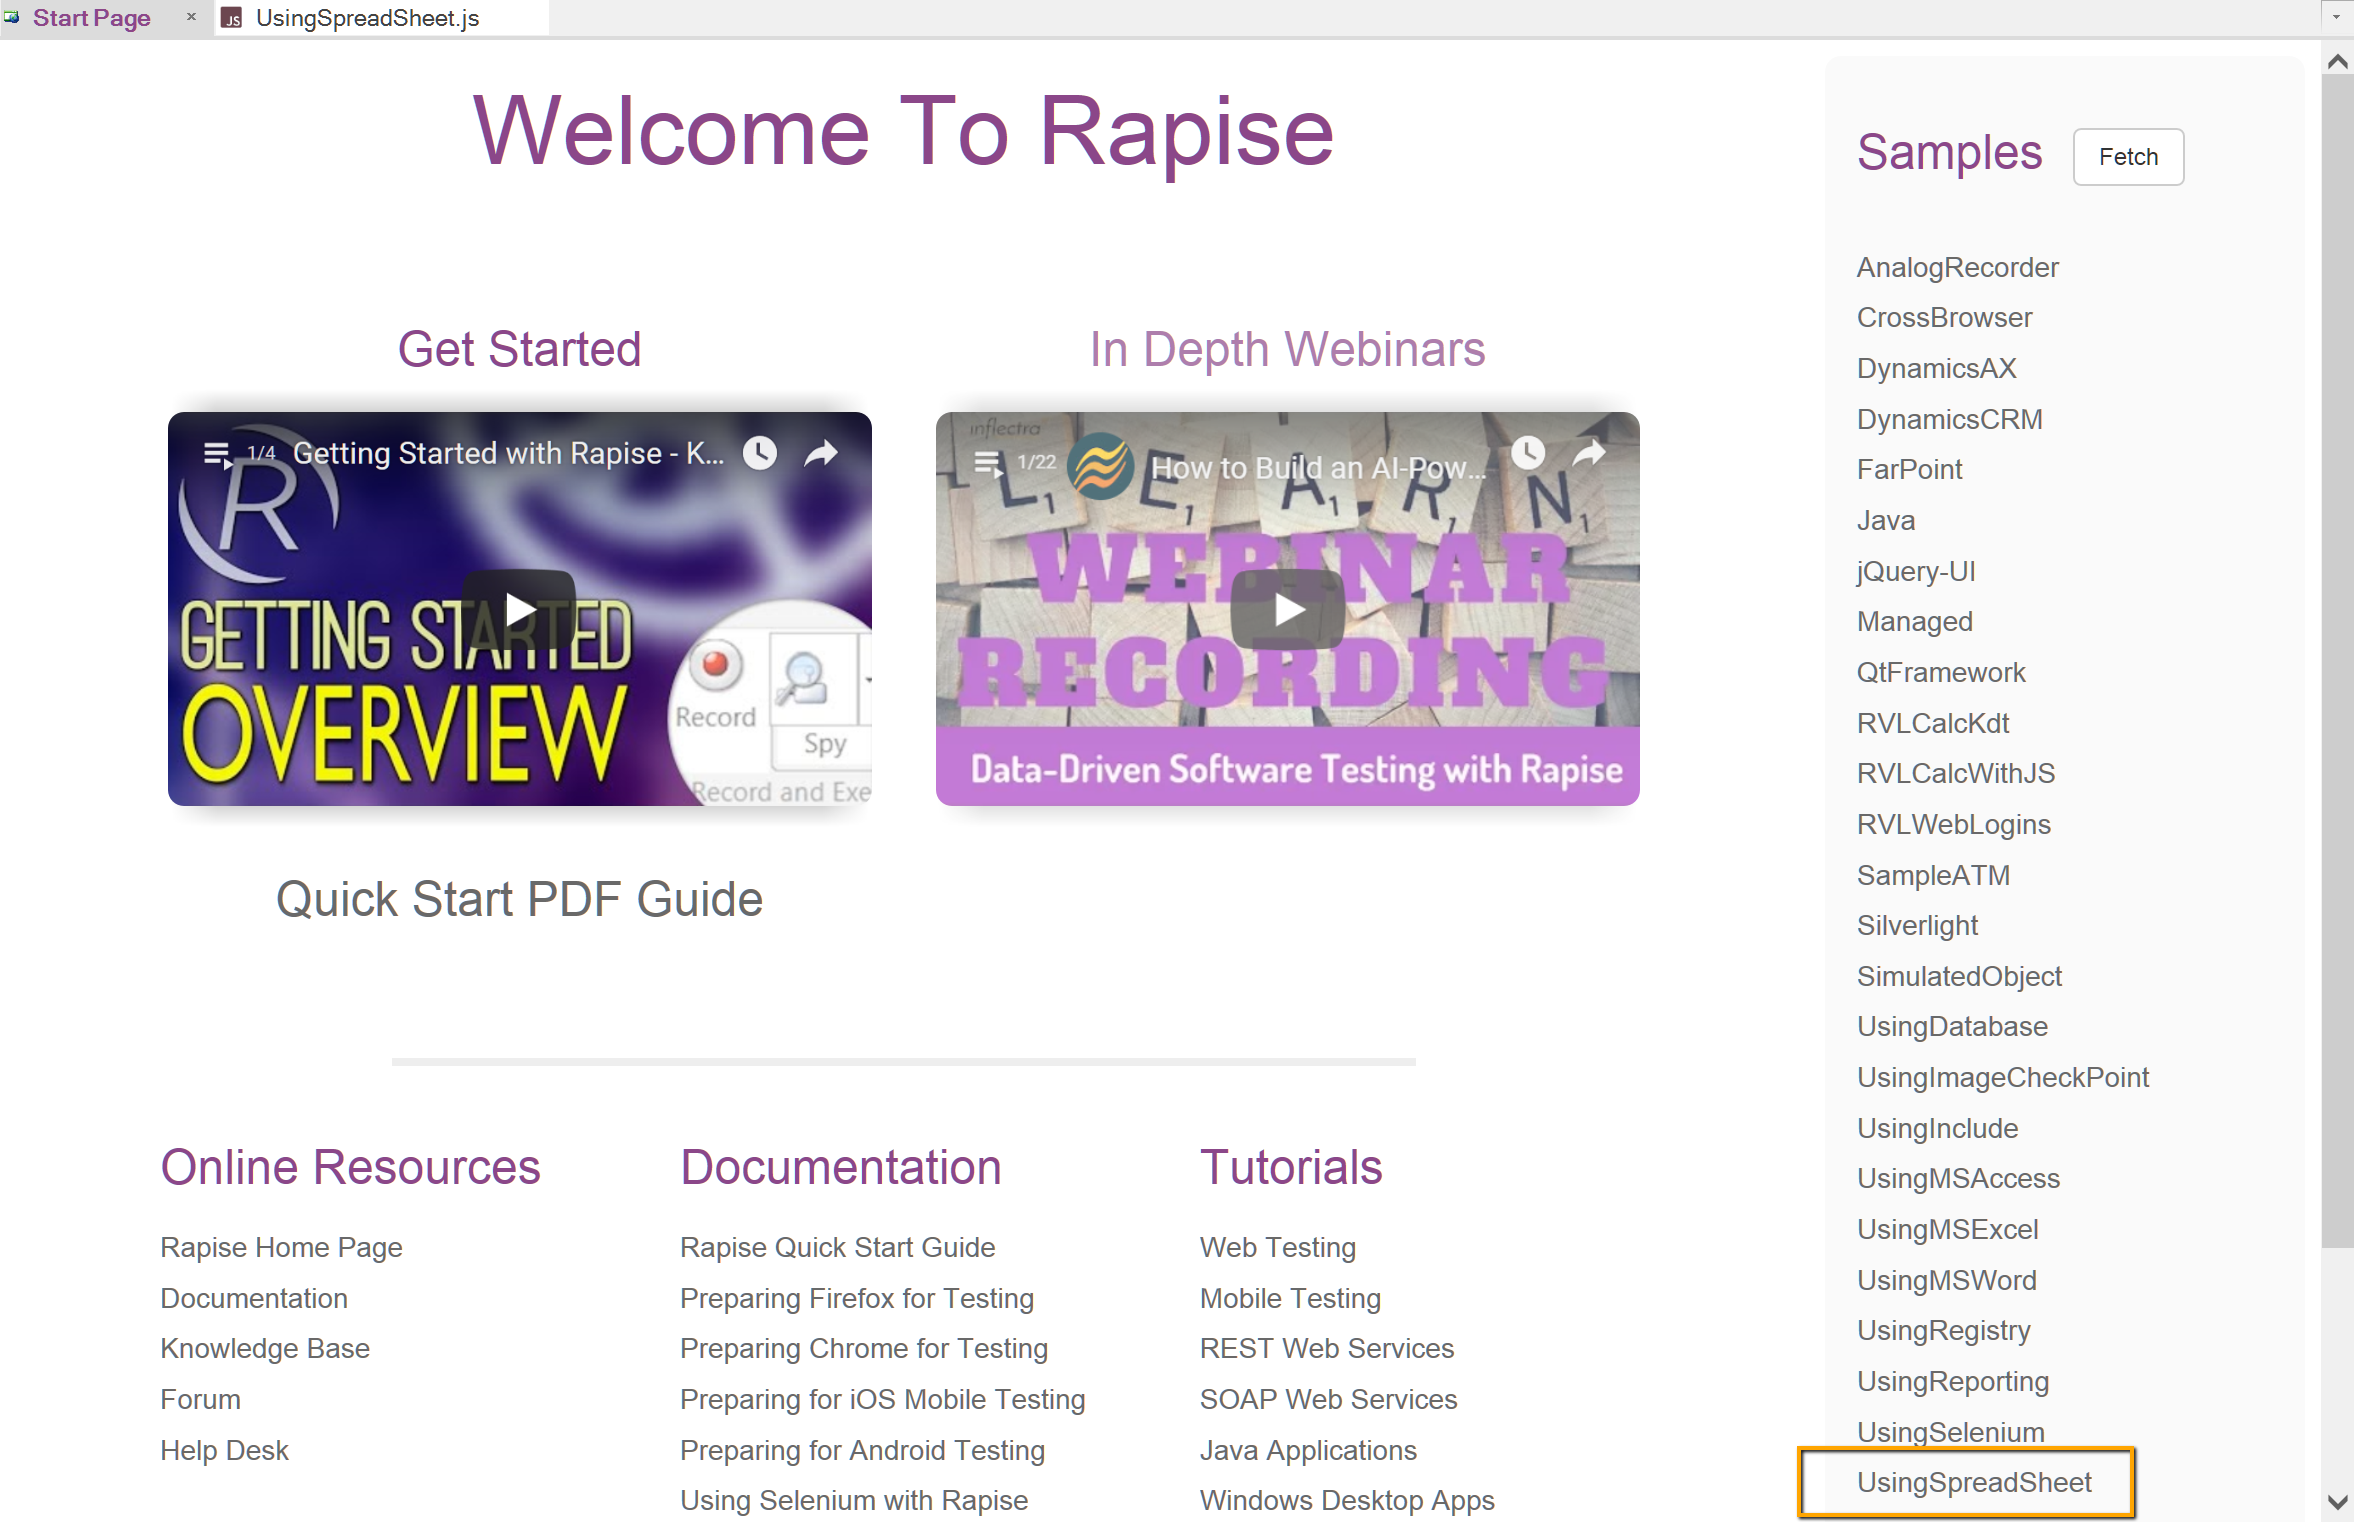
Open the UsingSpreadsheet sample test from the start page to see a working example (scroll down the list of samples).
See Also
- Data-Driven Testing (webinar)
- How To: Easily Attach an RVL Script to an External Spreadsheet in Rapise (watch video)
- KB432 Writing data to an Excel spreadsheet
- KB27 Using Rapise to extract test data from an Excel sheet
- Blog: Data-Driven Testing using the
Spreadsheetobject (JavaScript) - Data-driven testing tutorial (JavaScript)
- Parameters and Configurations